data visualization

Power bi

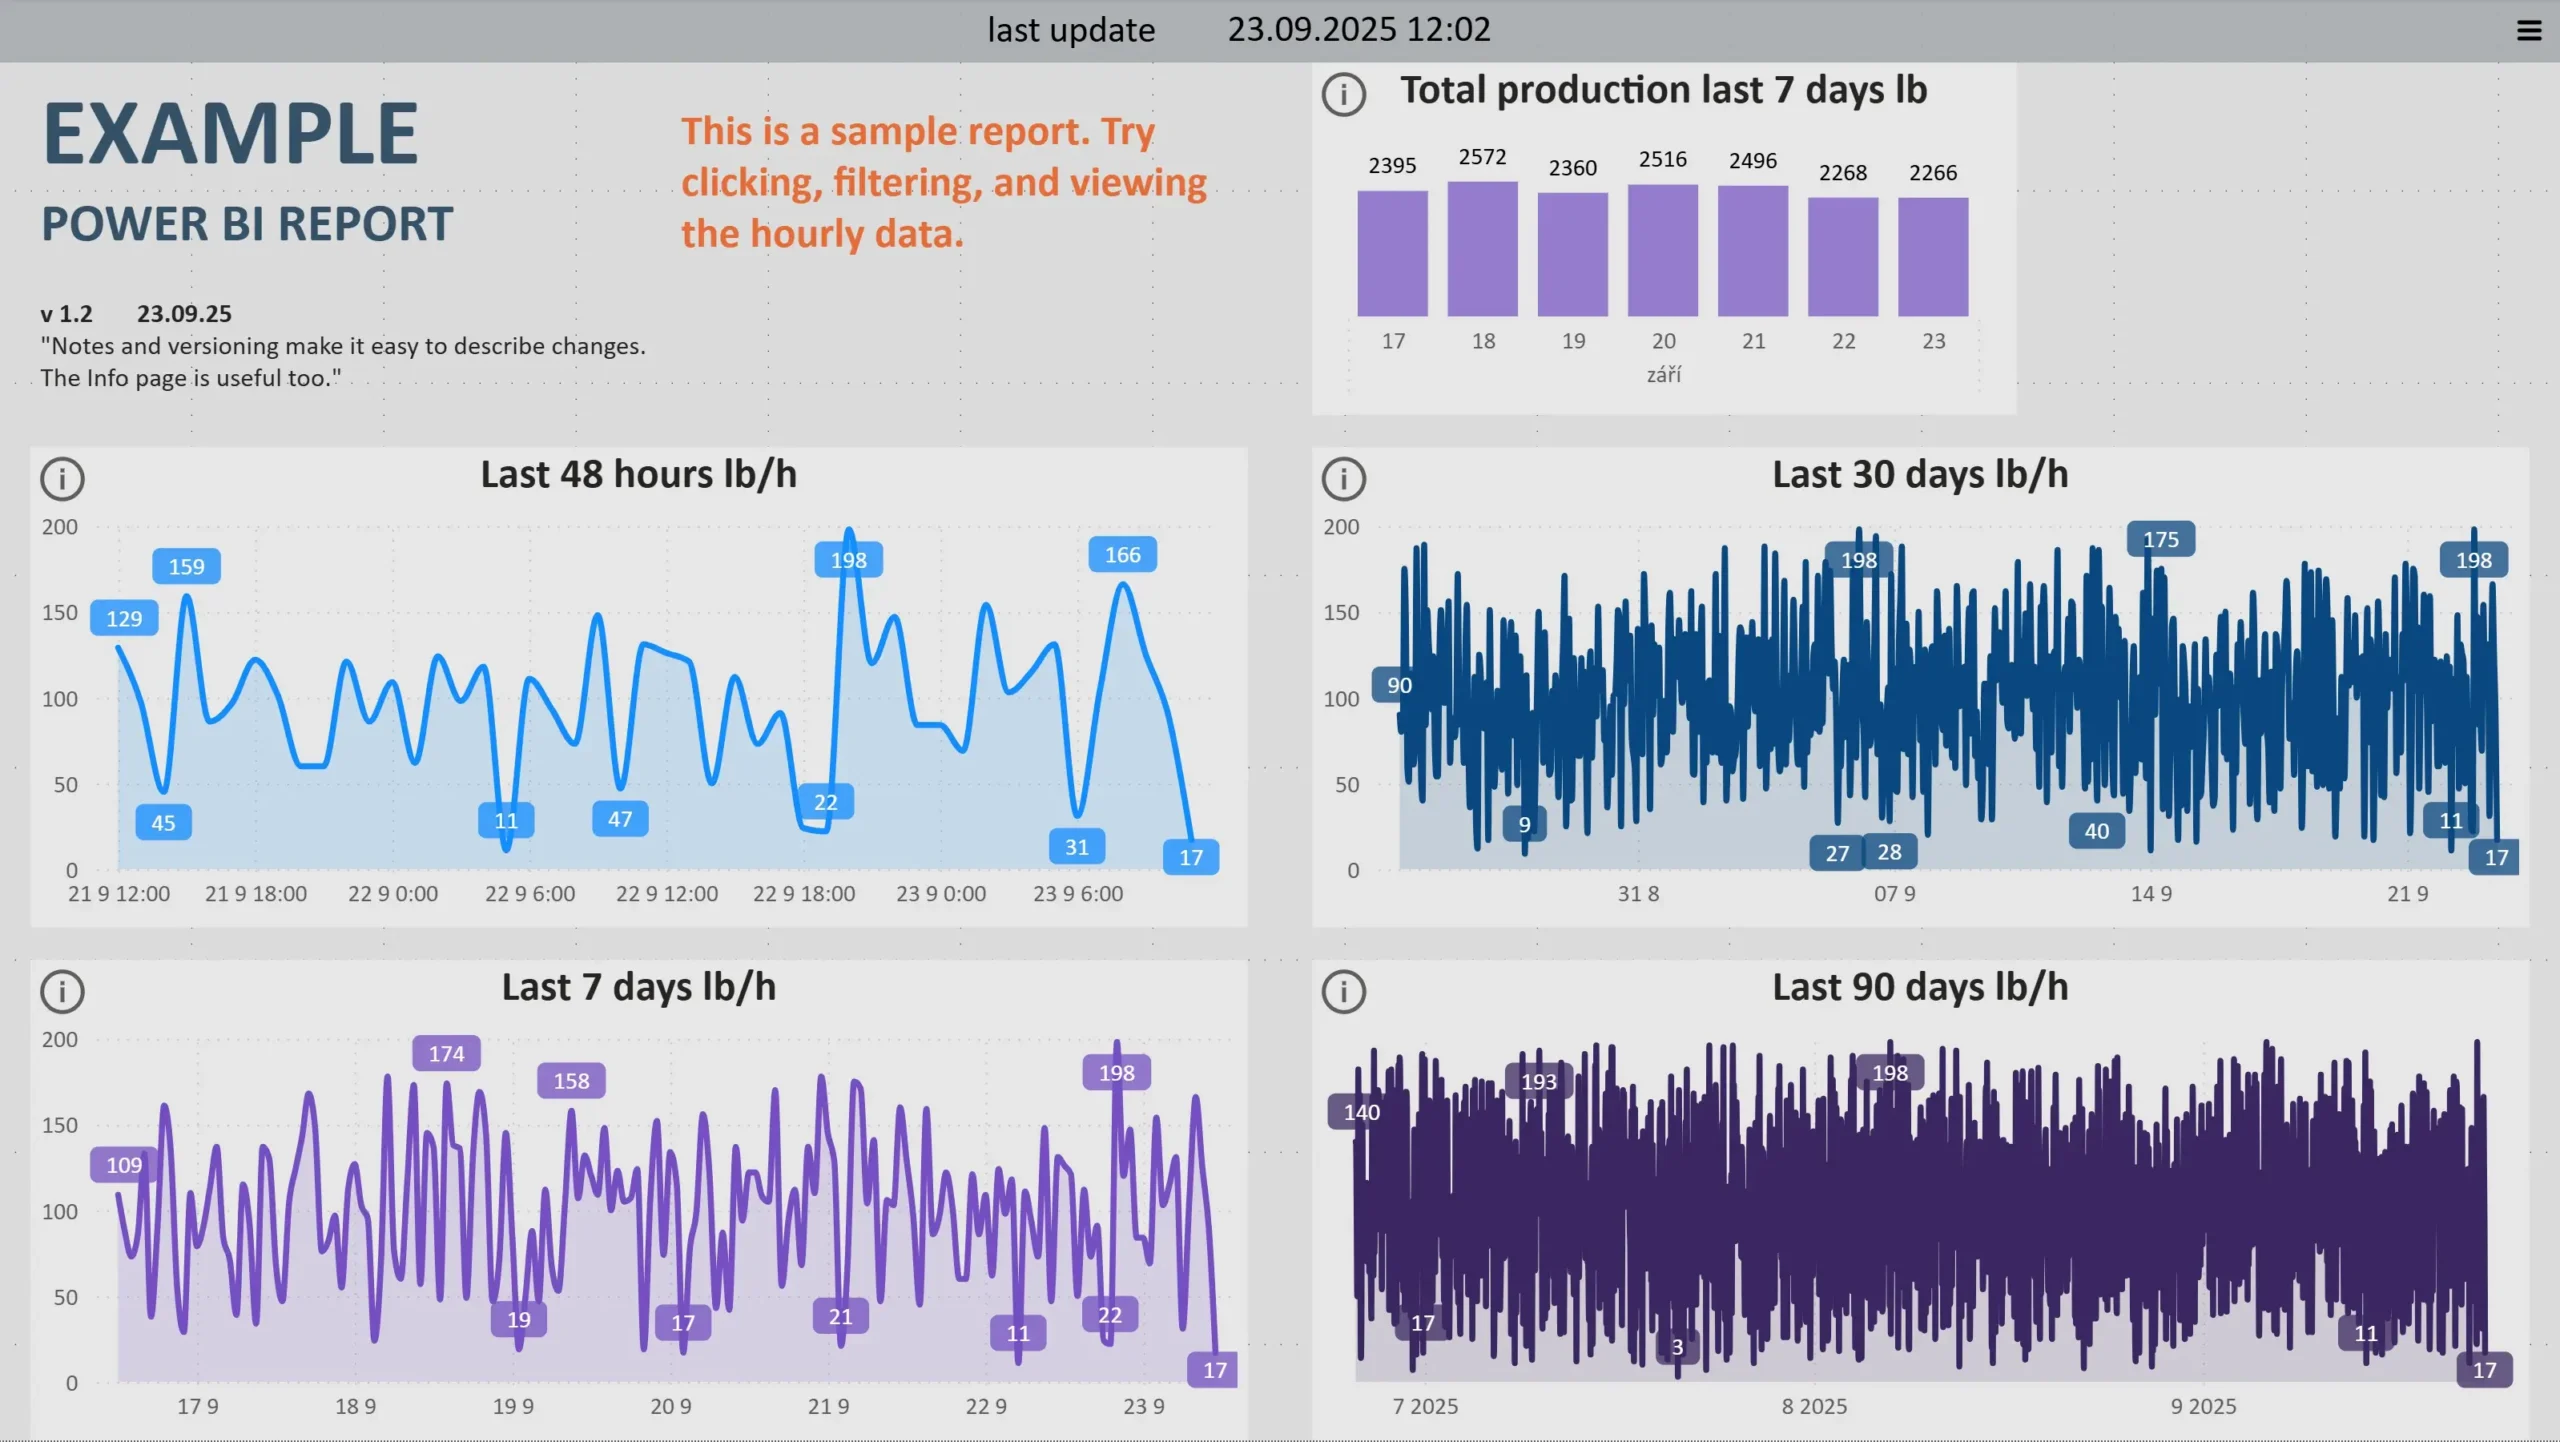
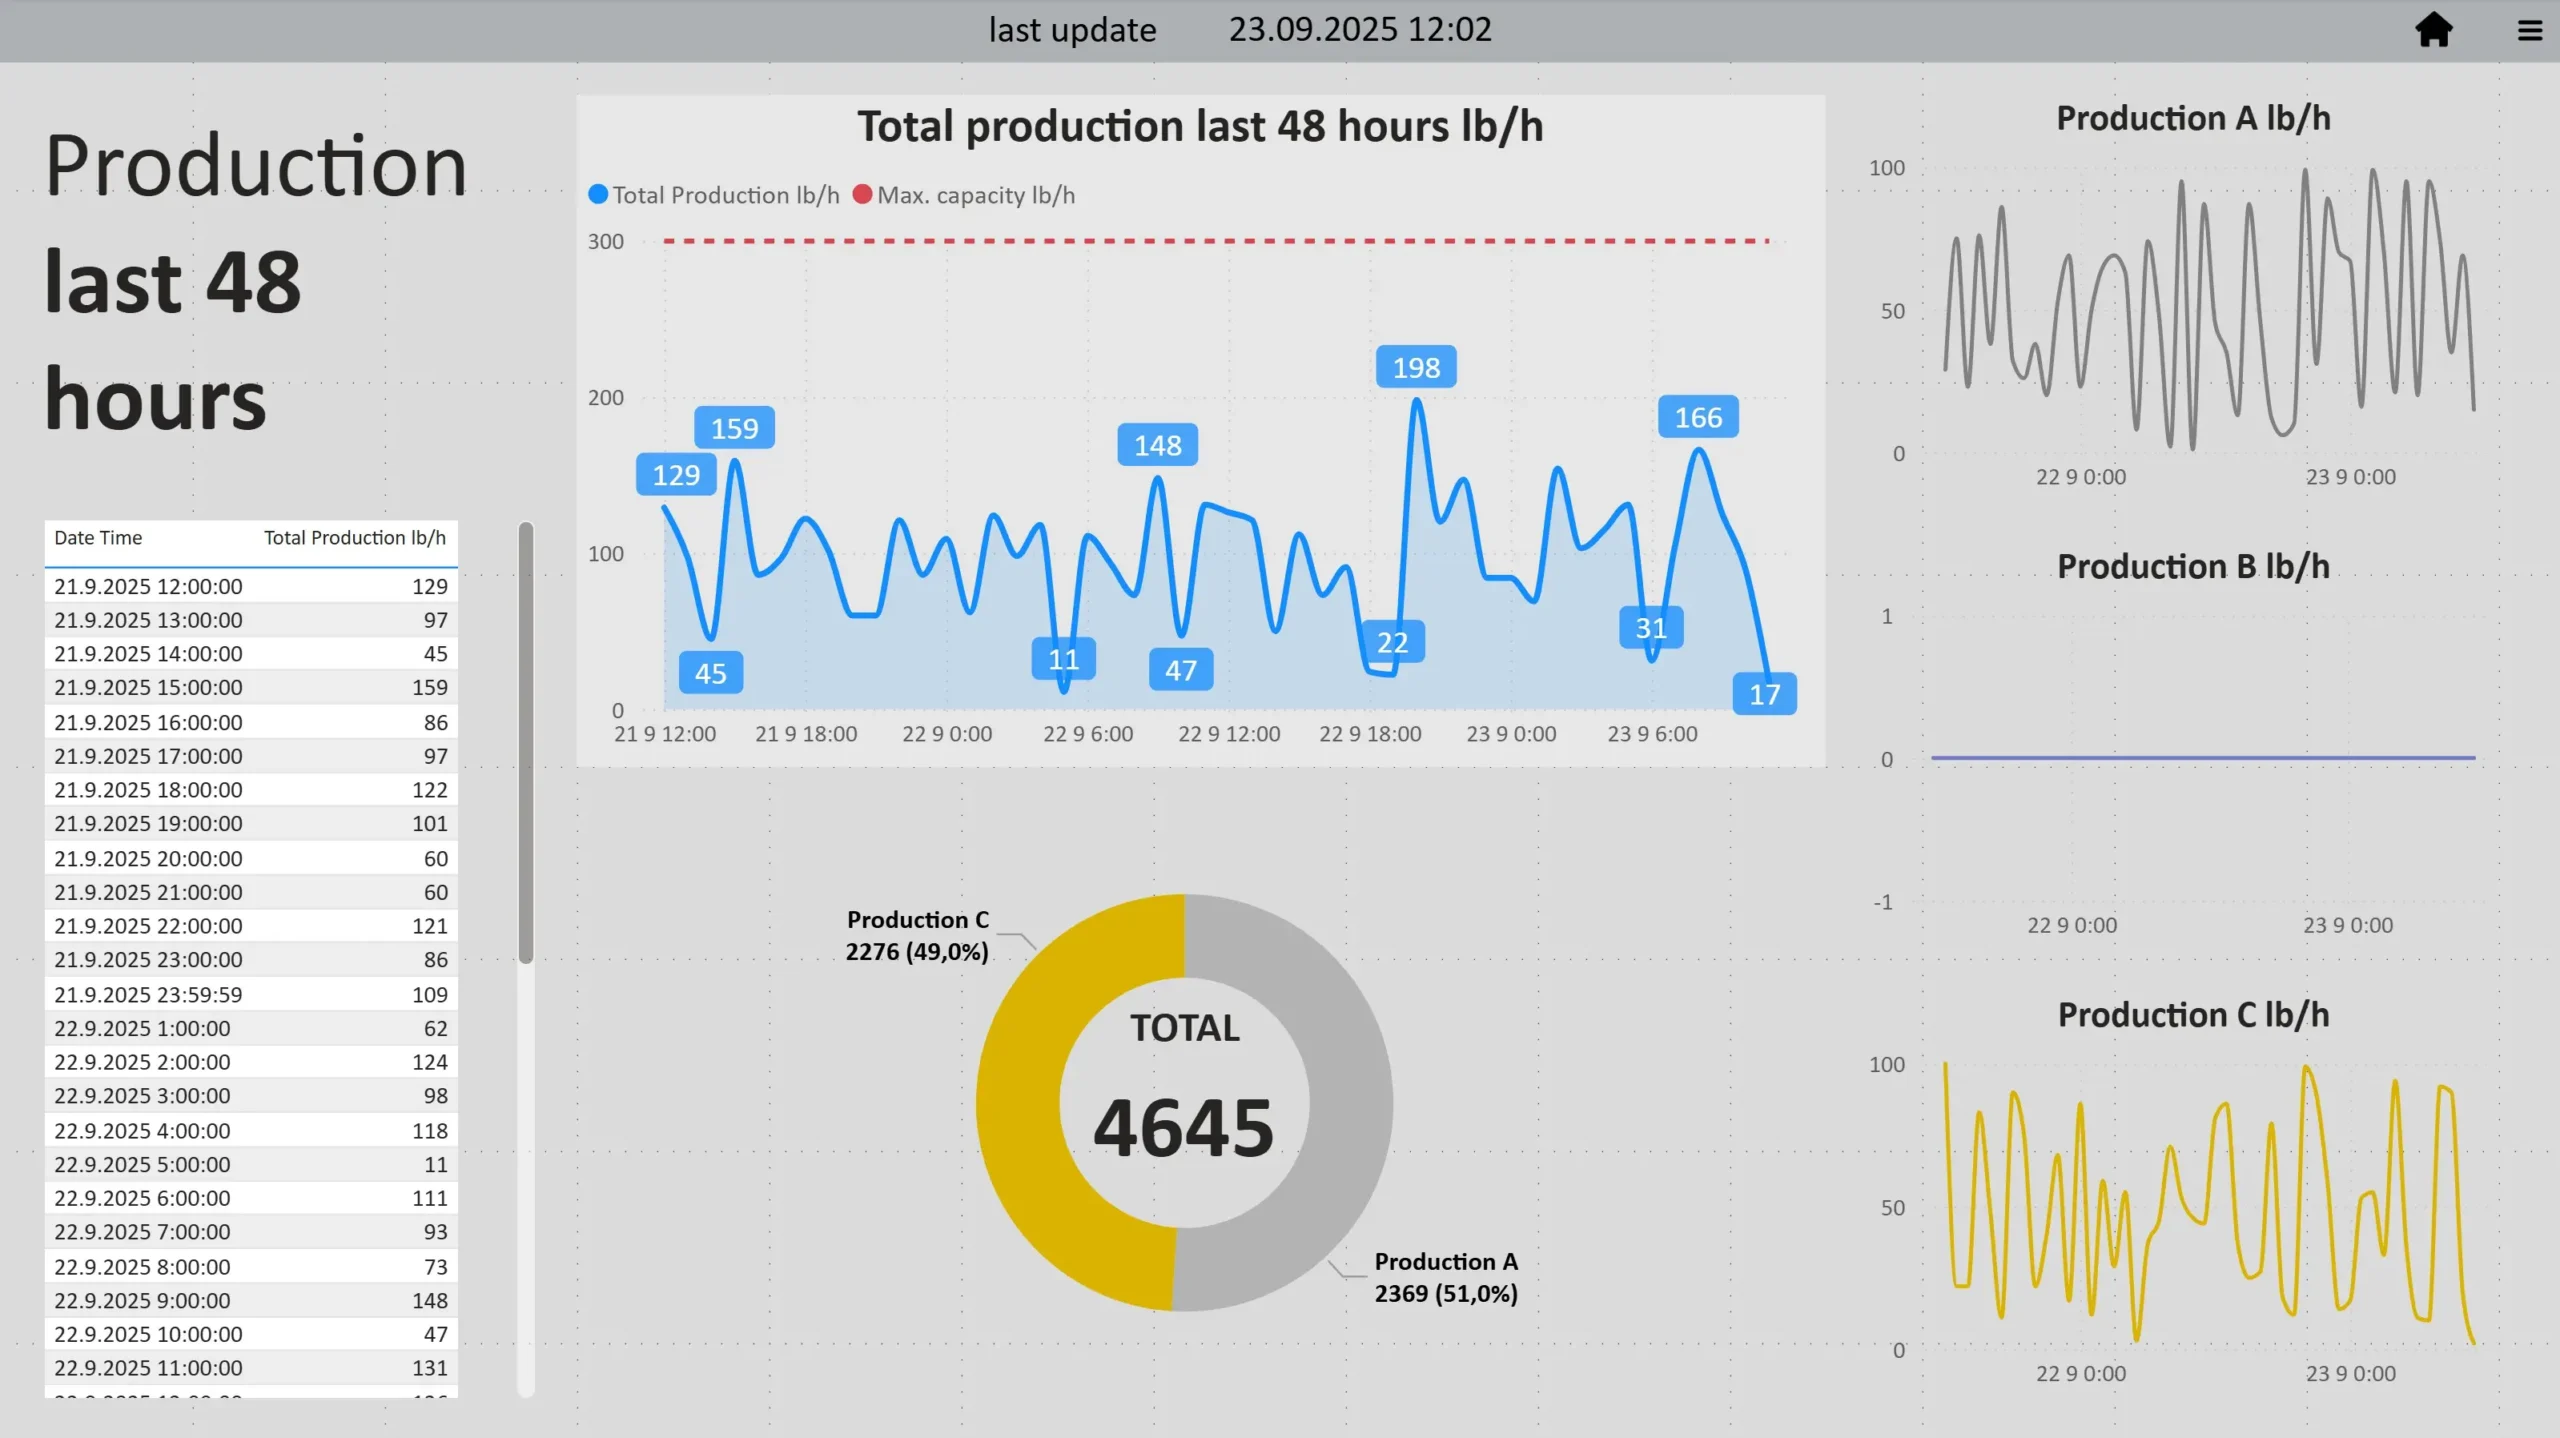
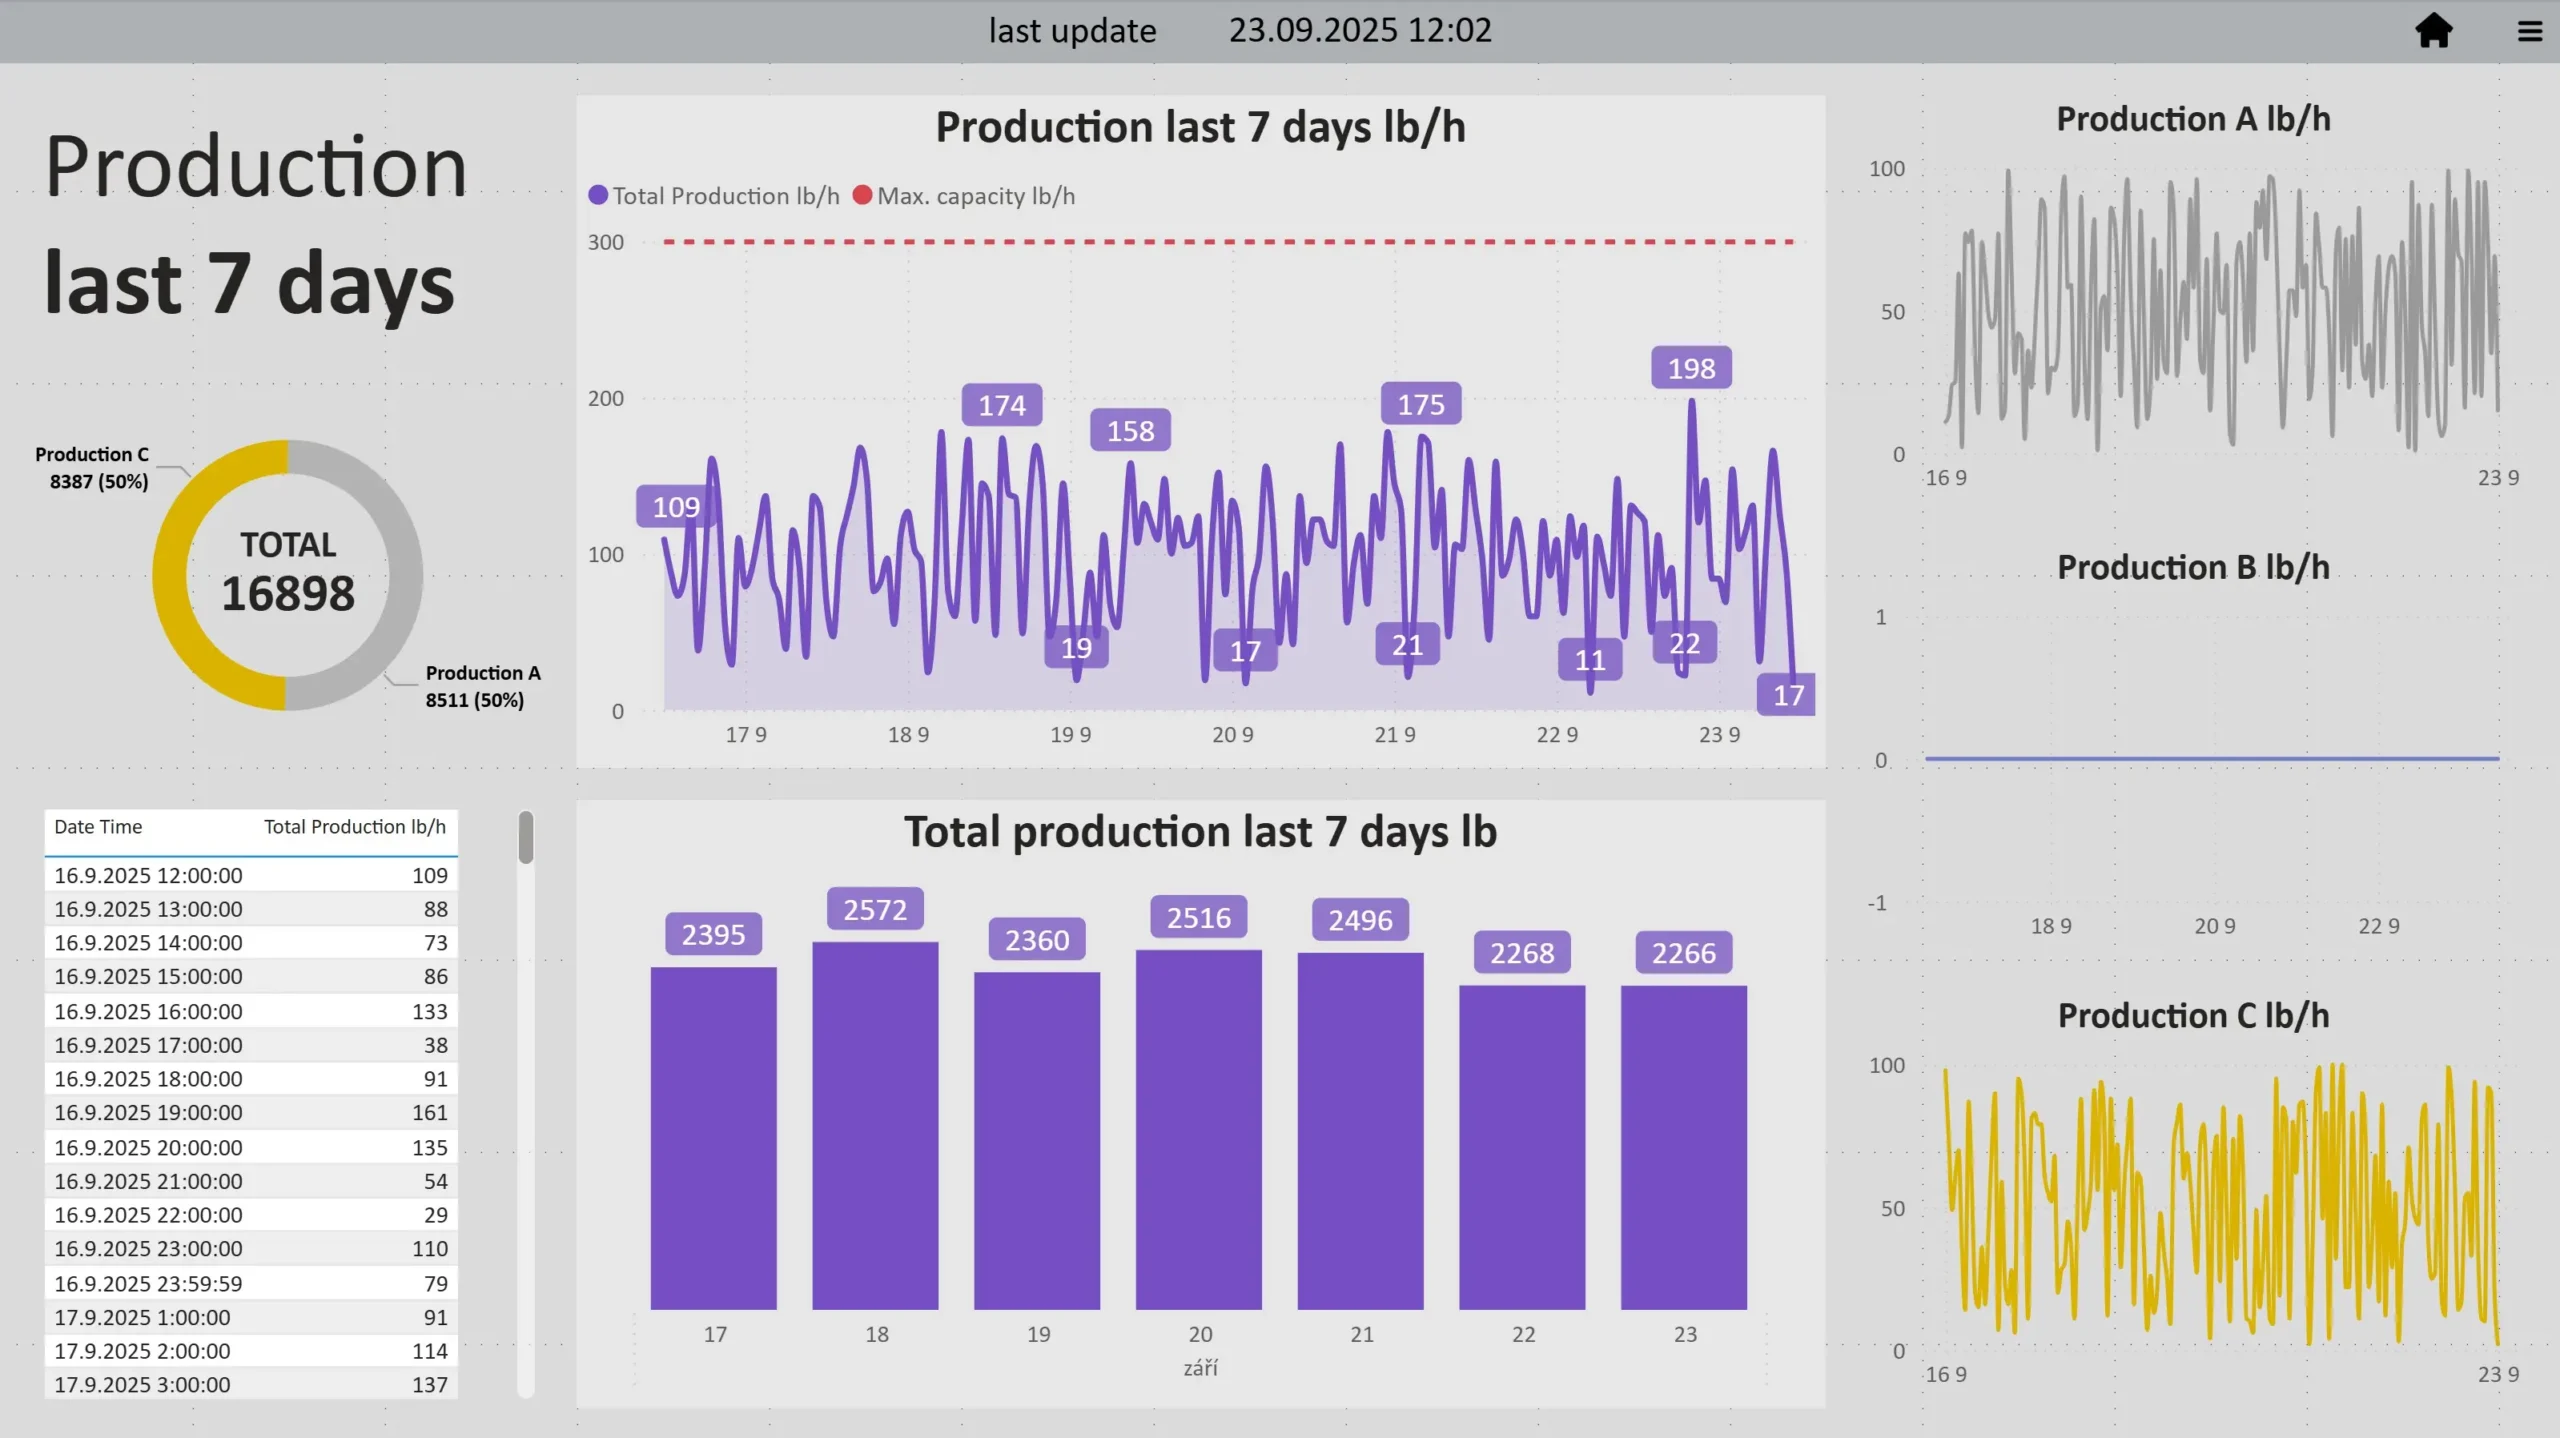
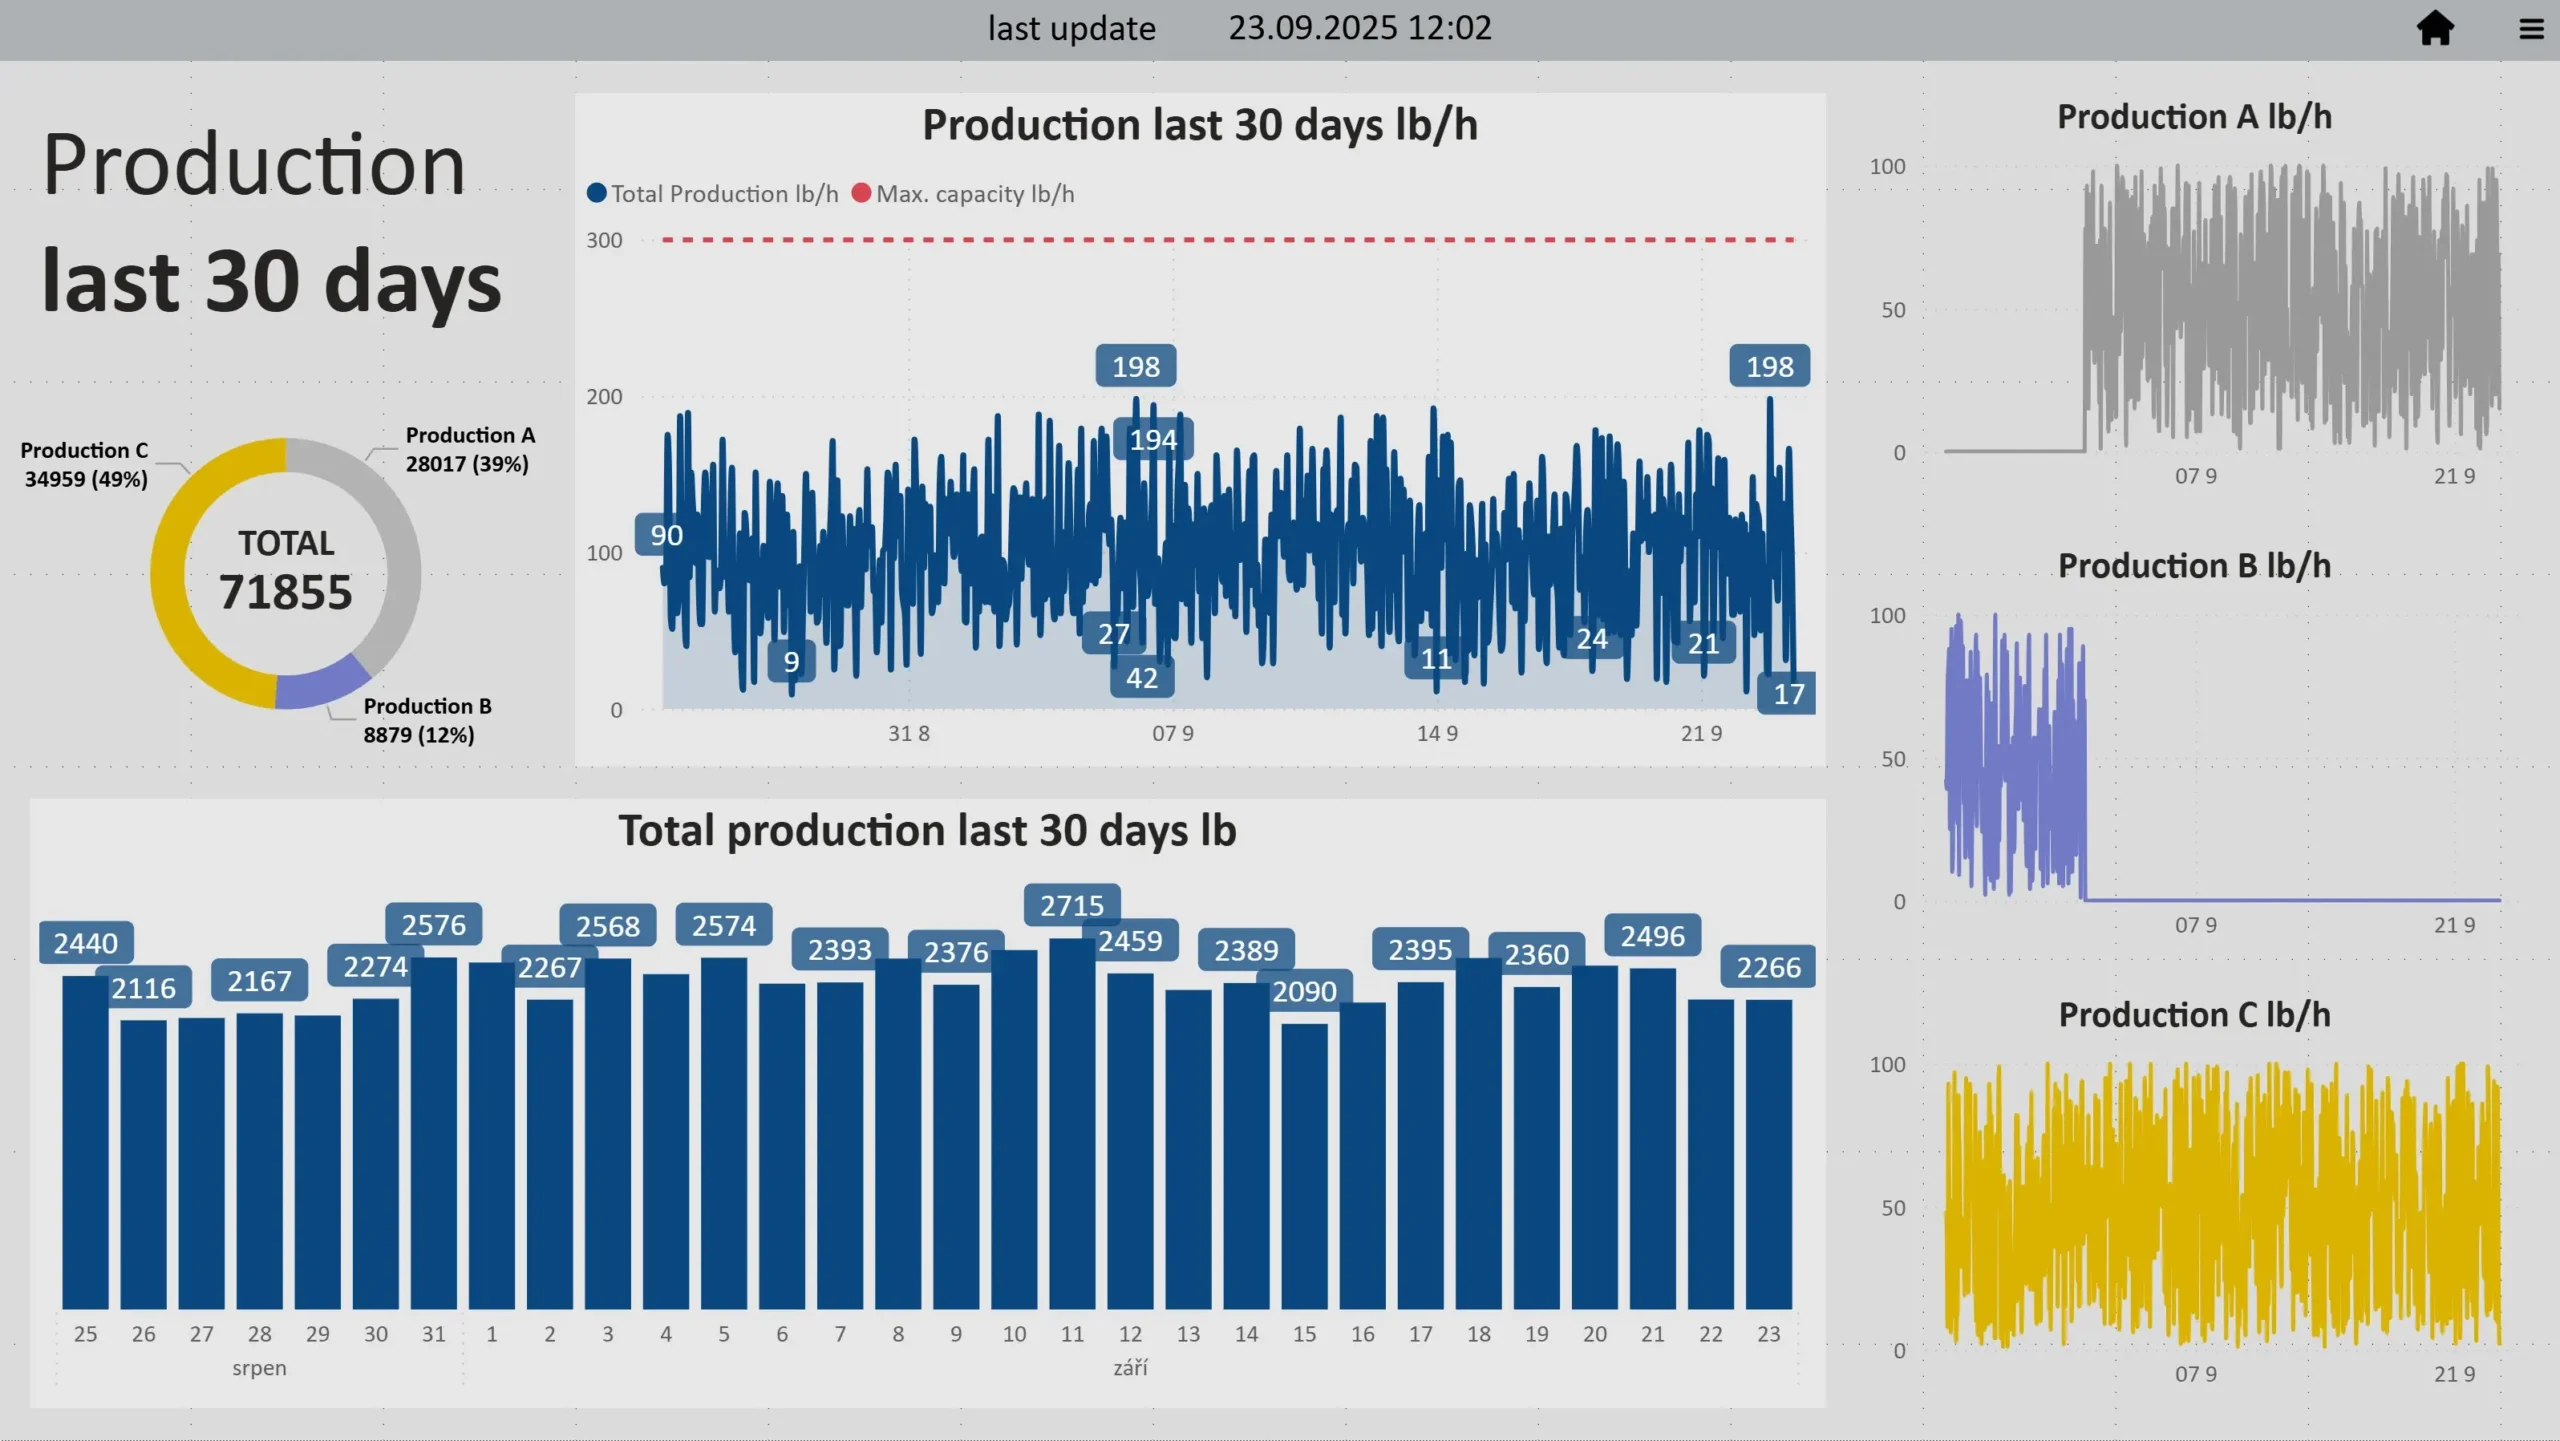
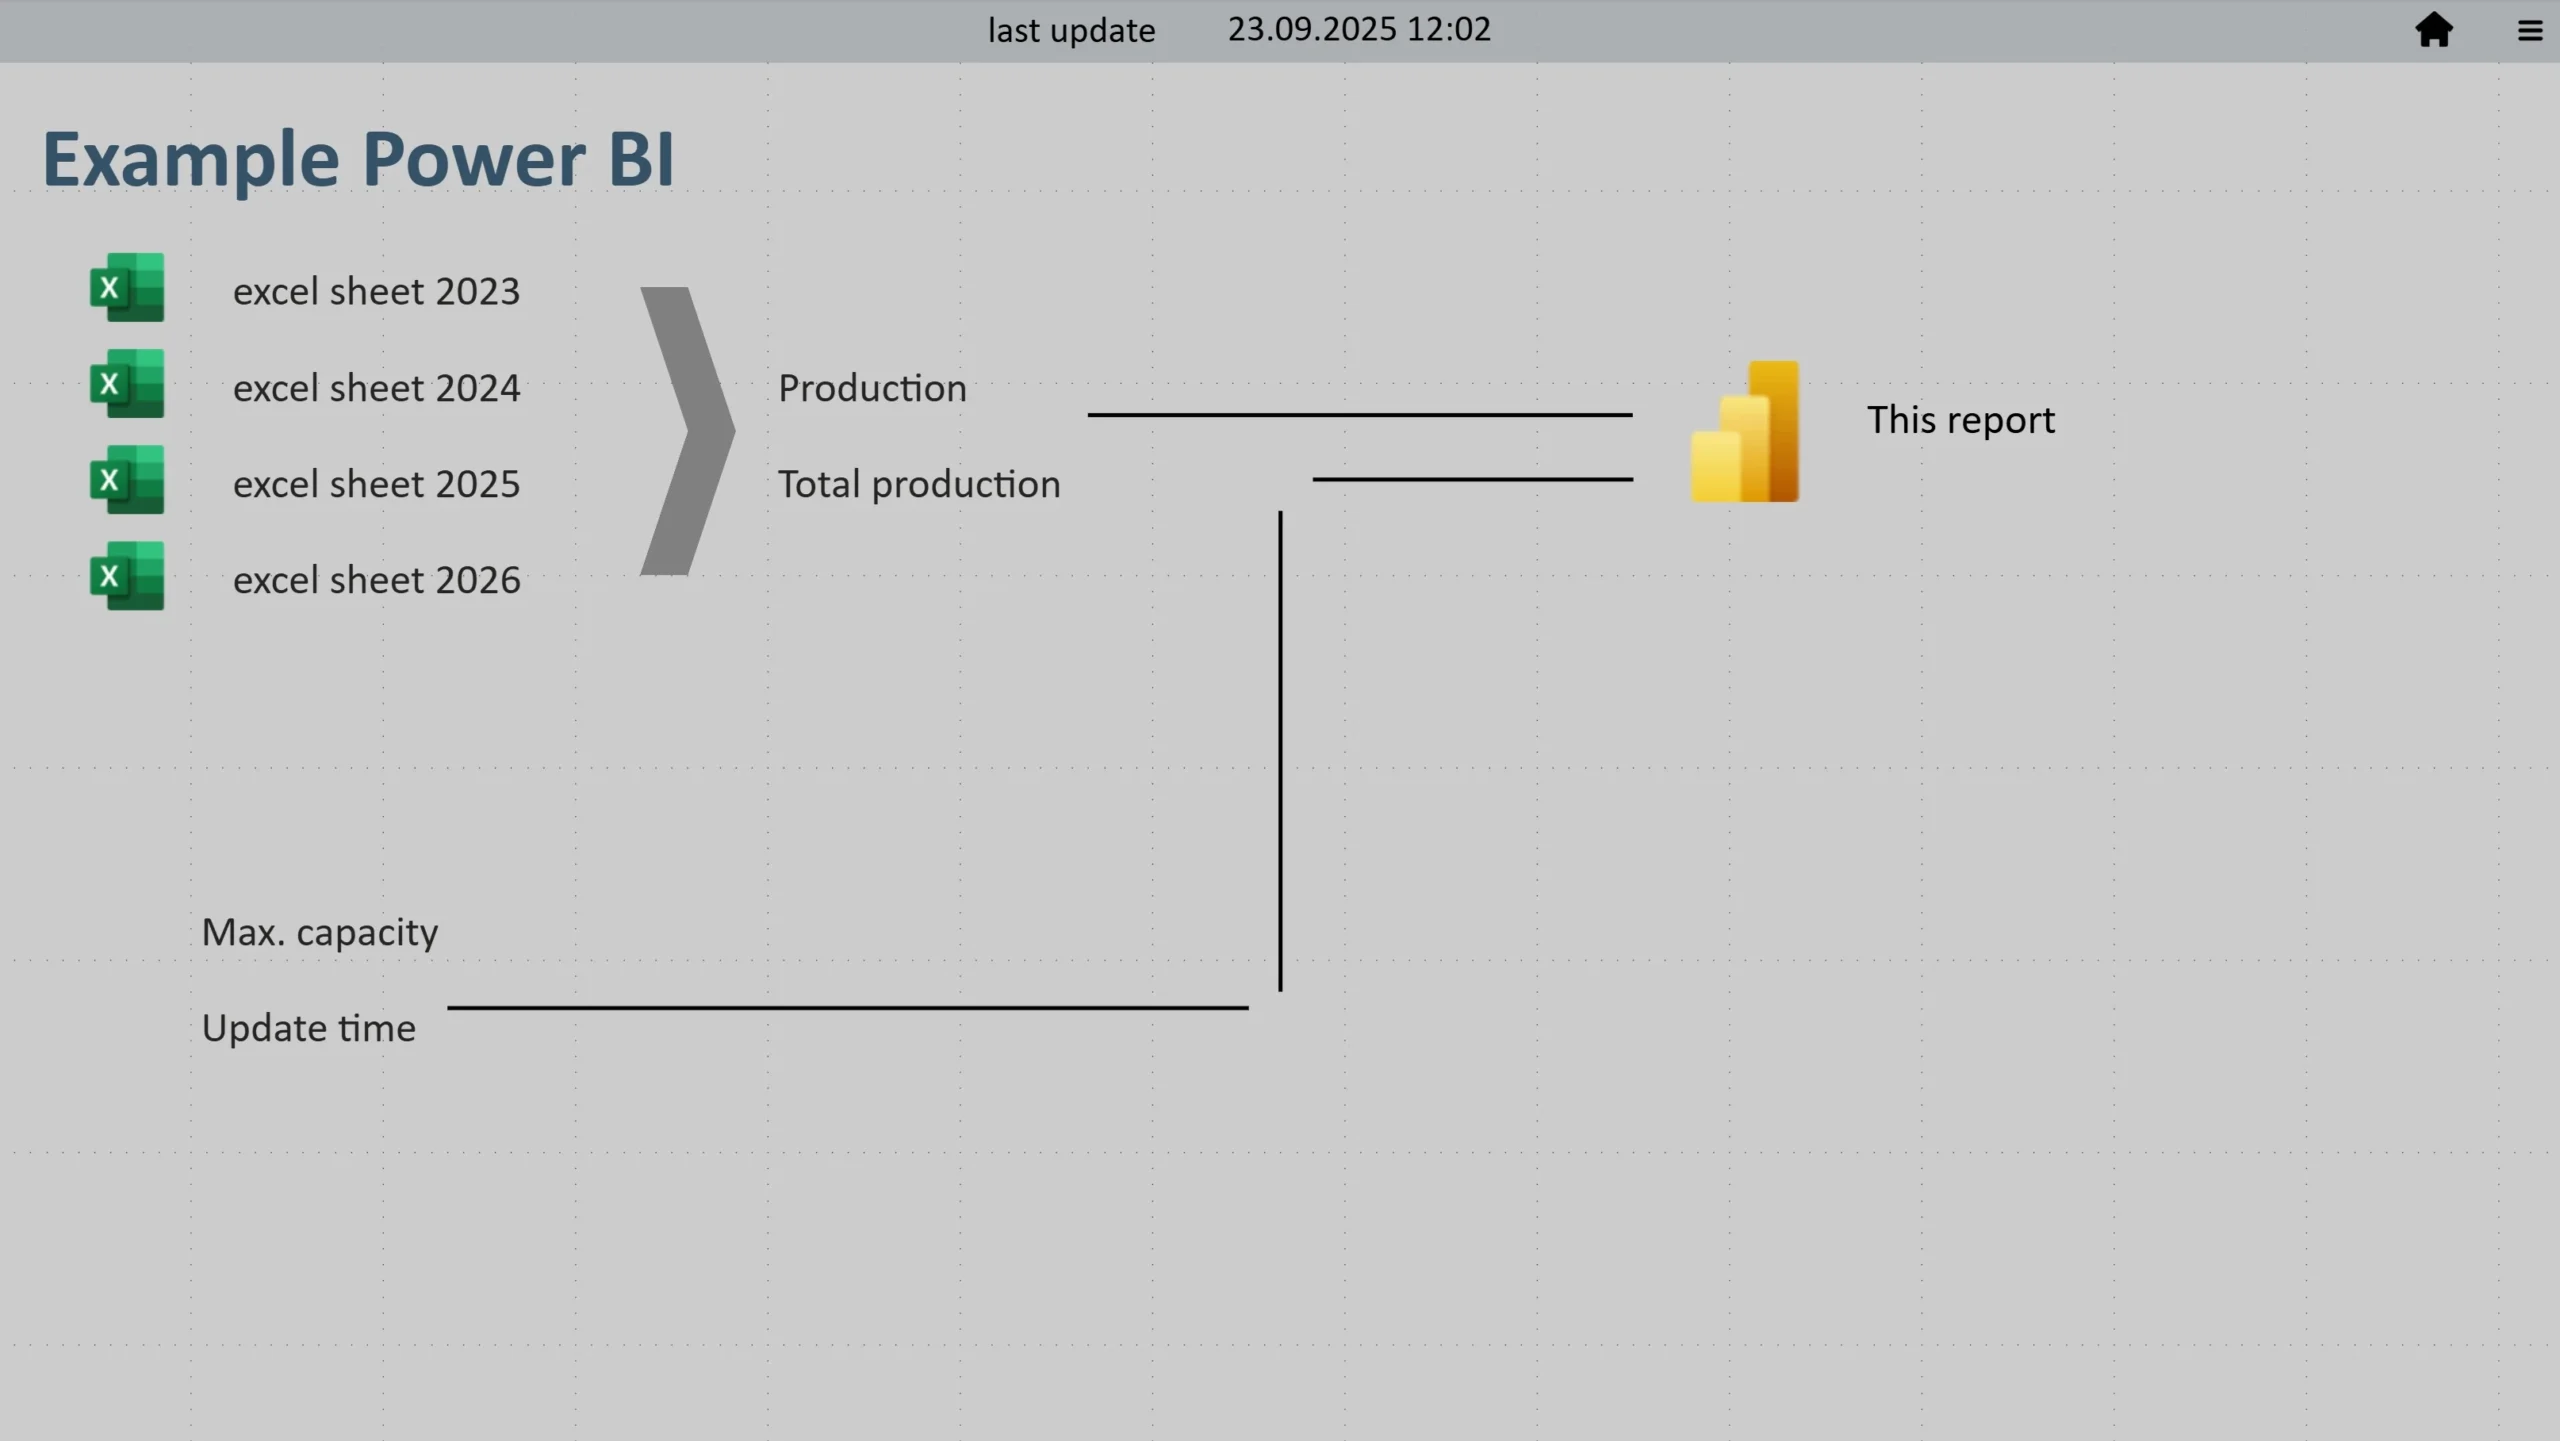
I created sample Excel workbooks and a Power BI Desktop report to help you get started. Download the files, open the PBIX and explore the visuals, slicers and hourly data.

What’s here

  • Sample Excel files with hourly data
  • Power BI Desktop report (PBIX)
  • Simple steps to connect, refresh, and explore

Gallery

How to set it up?

You have two options to run the visualization, including data refresh.

Create a folder

Create a folder C:\Example Power BI\ save all four downloaded Excel workbooks and the Power BI report there.

Save the files anywhere

Save the files anywhere. Open the downloaded Power BI report and update the file paths inside it.

Download files

PBIX sample report. Ready to use visualization for Power BI Desktop, linked to the Excel workbooks.

Large data sample

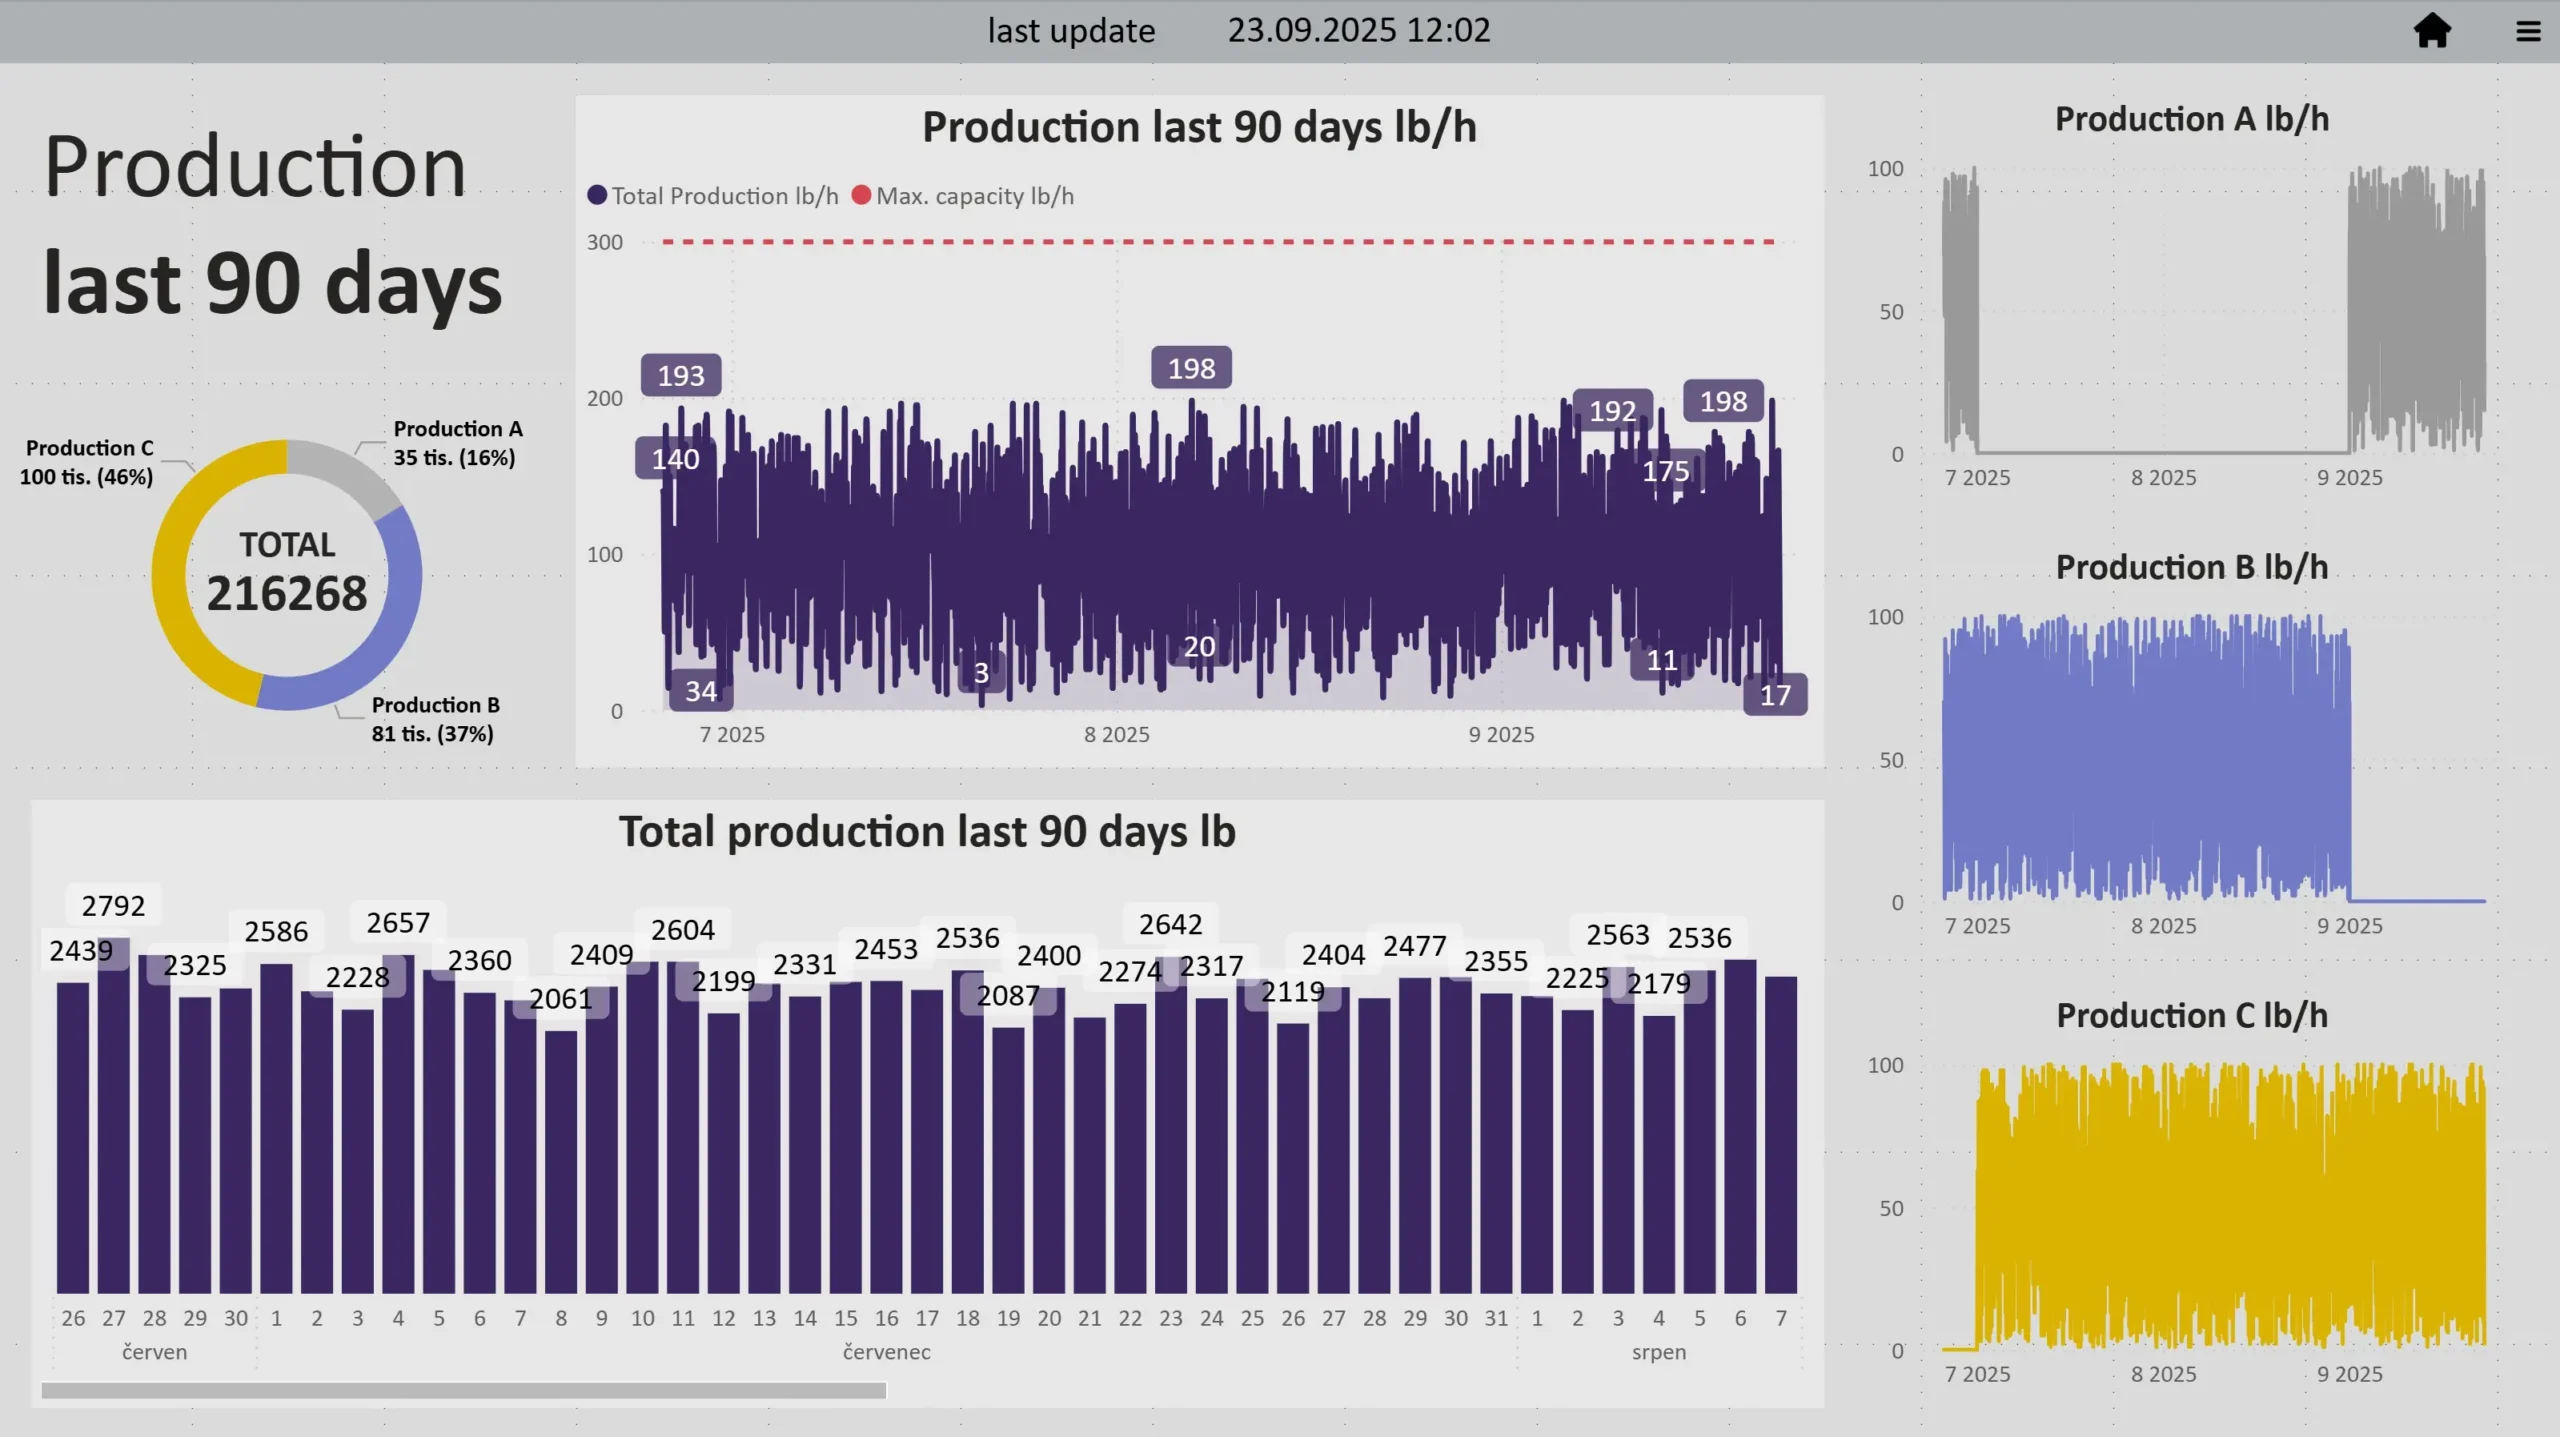
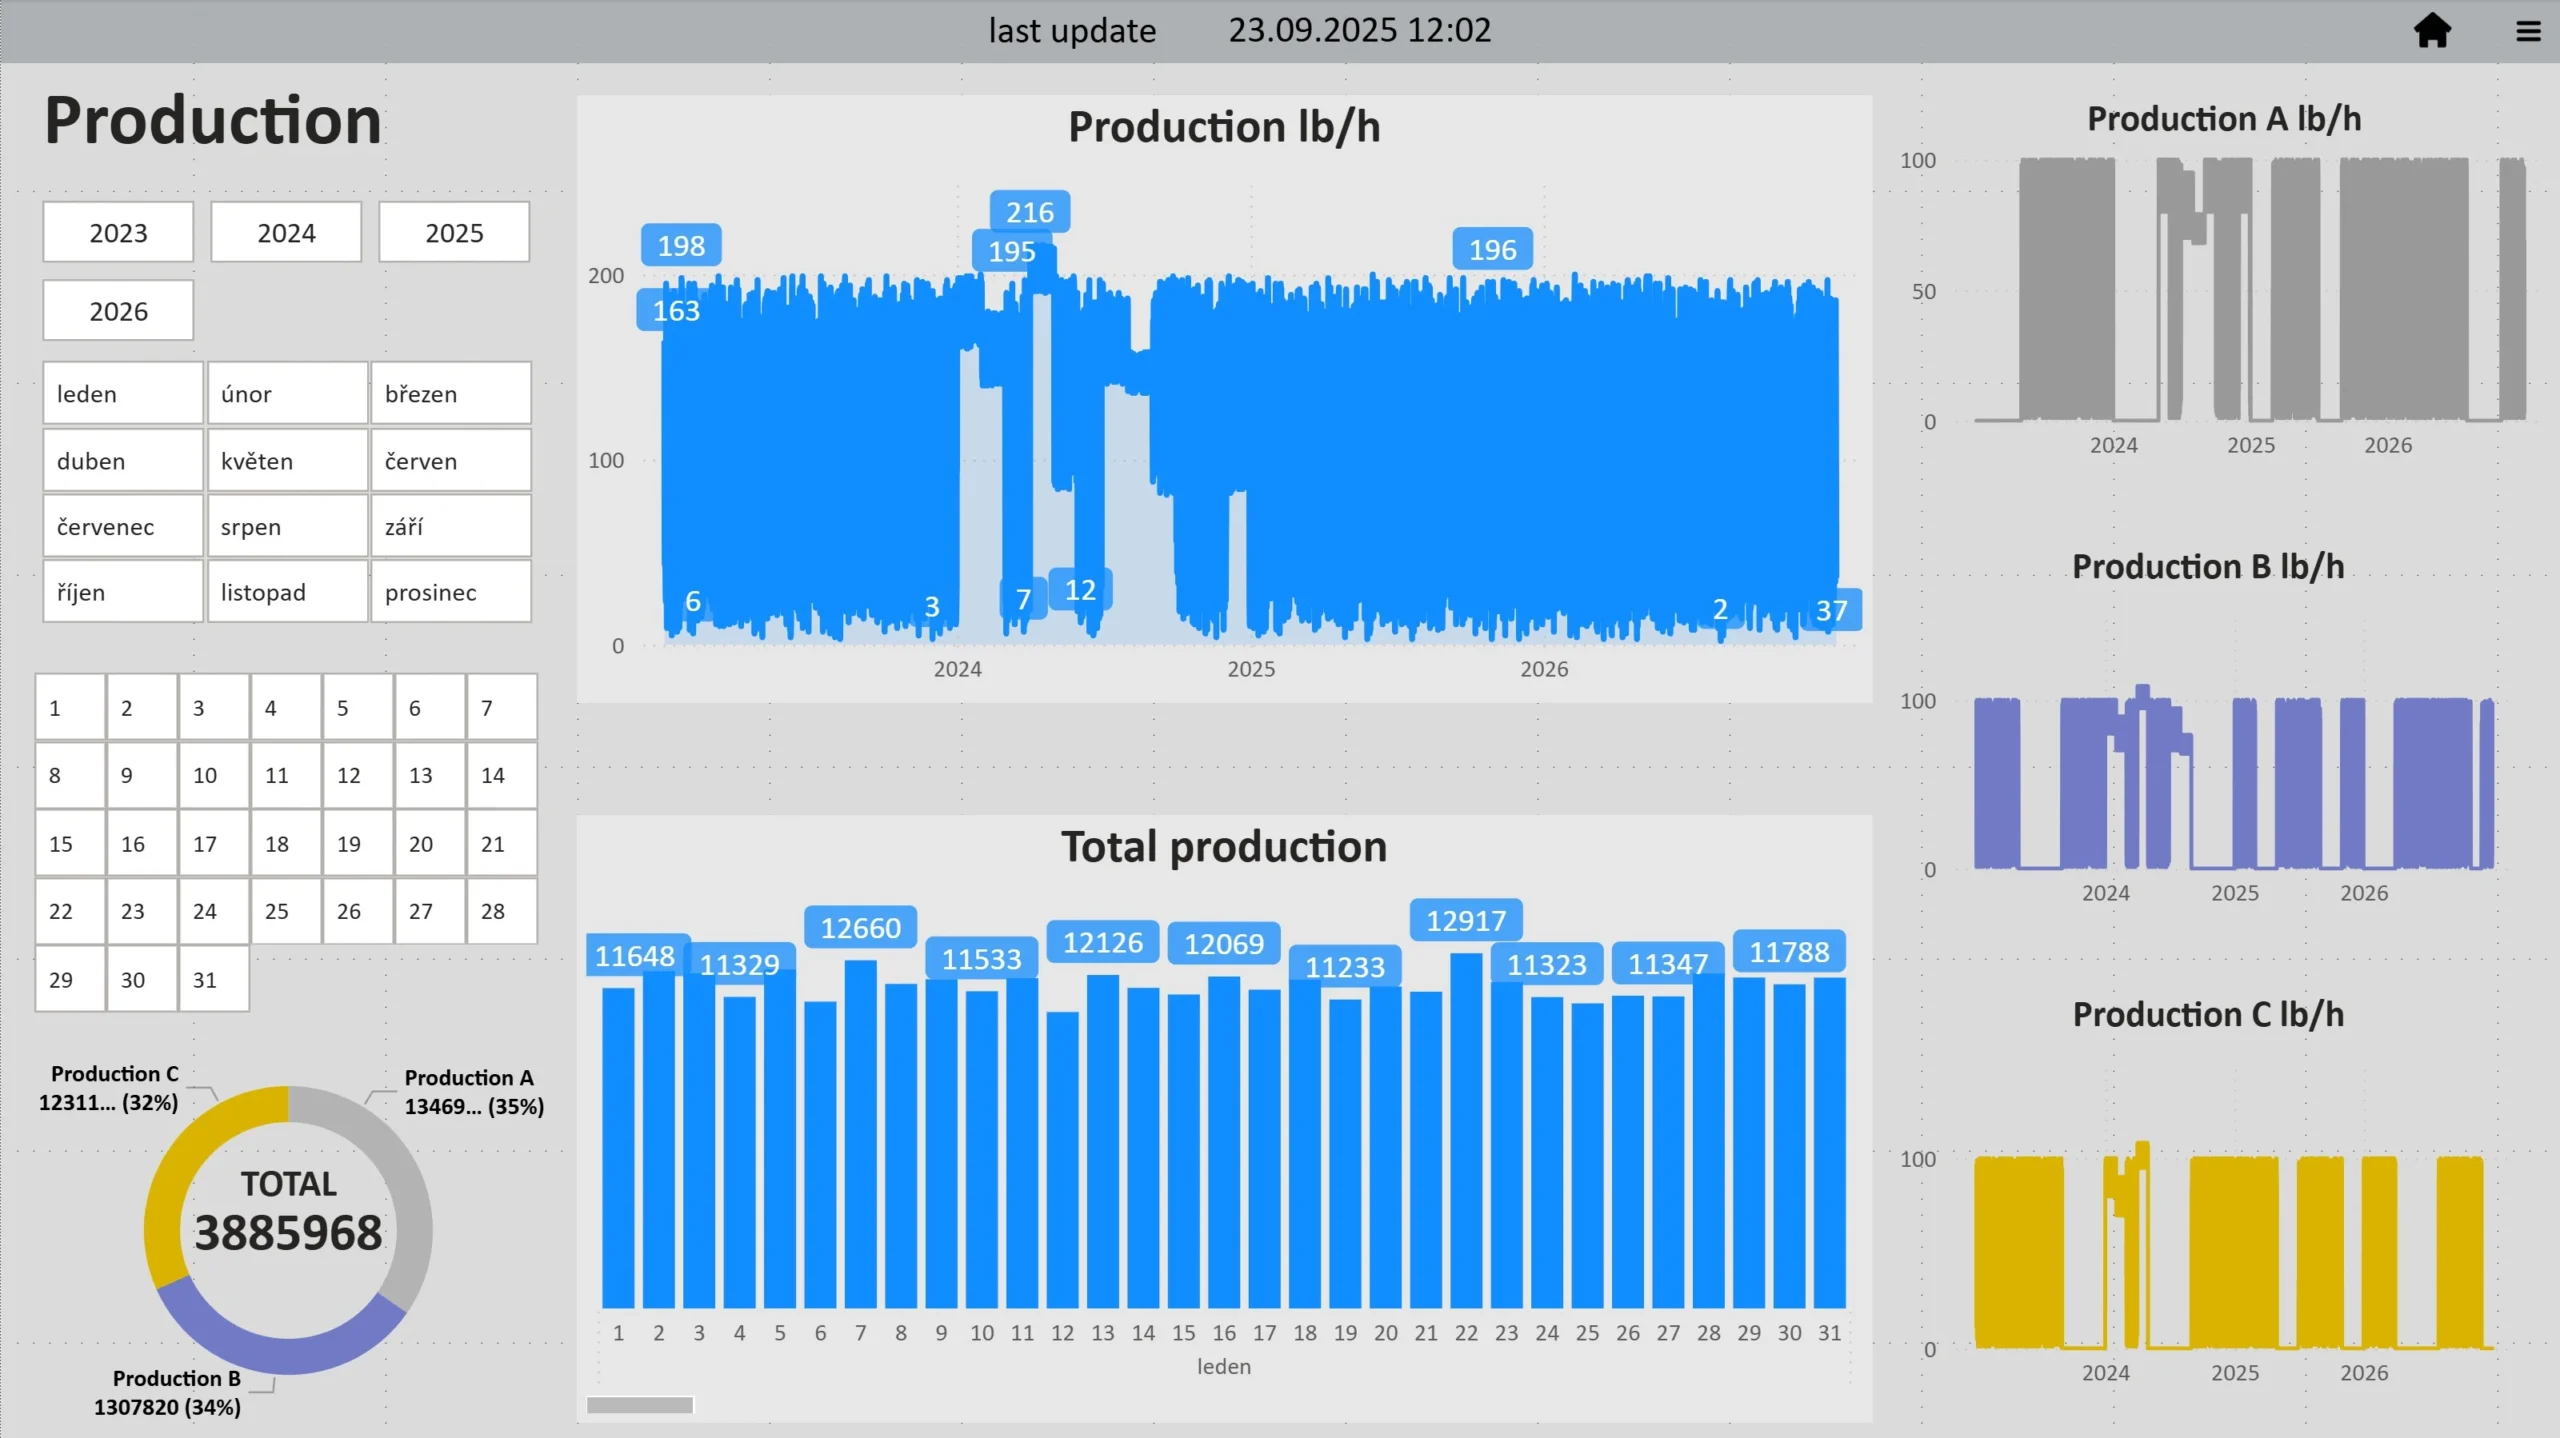
The Excel workbooks contain hourly records from 2023 through 2026, providing a sizable dataset for experimentation. Data is organized as monthly tables, with the final sheet consolidating each full year.

Mobile experience included

The Power BI report includes a mobile layout, so you can preview how the visualization will look on a phone.

email

Do you need help with the sample report or the data?

petr@angrychip.com

Přejít nahoru